The Project www.flosm.org
First steps
When we started experimenting with data from the OpenStreetMap project in 2009, we were keen to find out whether the data quality could keep up with commercial offerings.
The quality comparison
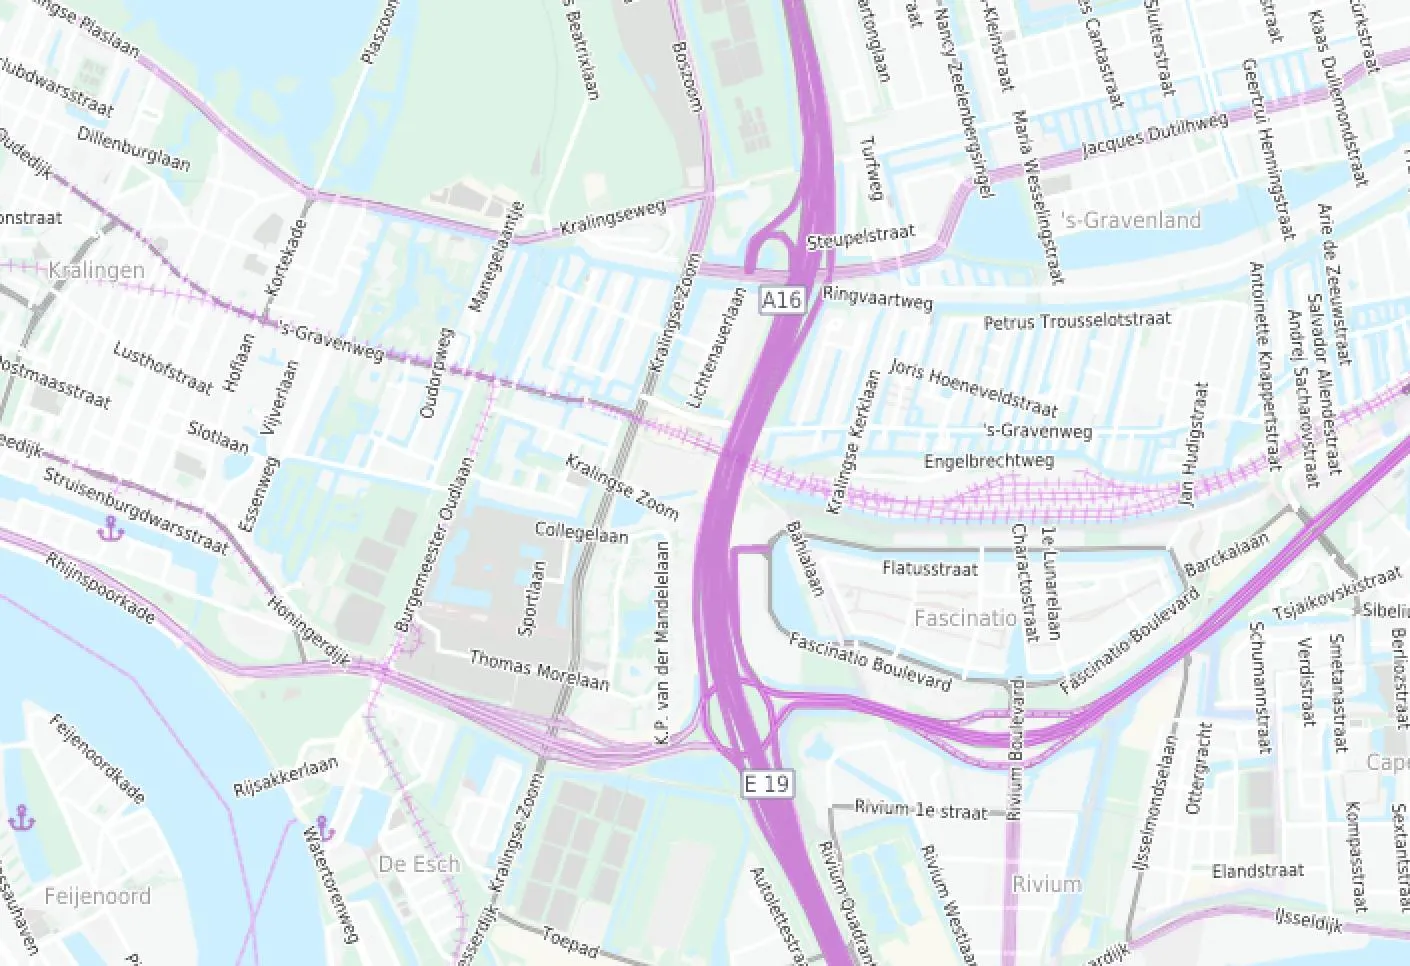
To do this, we built an interface with which we superimposed commercial vector data (street courses) over the OpenStreetMap maps. This made it possible to compare the road courses of the commercial provider with OpenStreetMap in a map of Germany.
In this screenshot, official data (in purple; Eurogeographics 1:10,000) is superimposed on an OSM map.
The quality was already promising and we began to look more closely at the OpenStreetMap project. It turned out that much more information than just road data was available there.
Visualization of recorded content in specialized theme maps
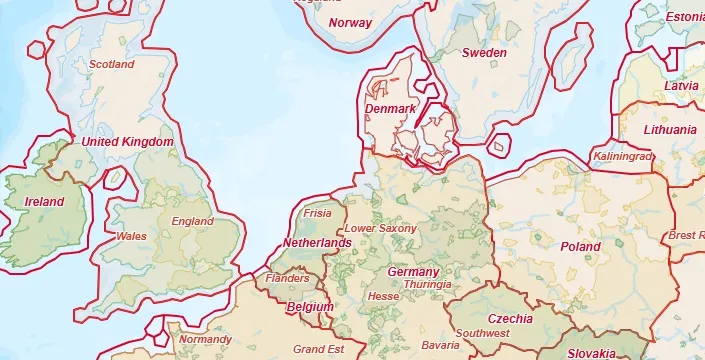
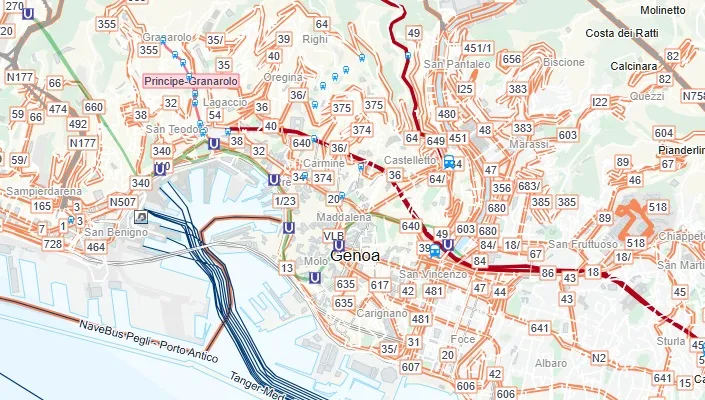
This was so intriguing that we launched projects to visualize special maps. Today, you can find a map with extensive points of interest (POI), a public transport map, a power grid map, a map with worldwide administrative boundaries and a map on the subject of shipping and water sports.
Continuously increasing number of visitors
Gradually, more and more visitors were recorded there every month, so that we continue to maintain the site to this day and make it available to all interested parties free of charge.
All the contents of these maps can also be integrated as a WMS service in QGIS etc. and combined as required. The topics are far from over. As soon as we can spare some time, we will make more maps available there. In this way we want to make the numerous areas of application of the free world map accessible to a wide audience.